BMP My Watershed Practices

Introduction

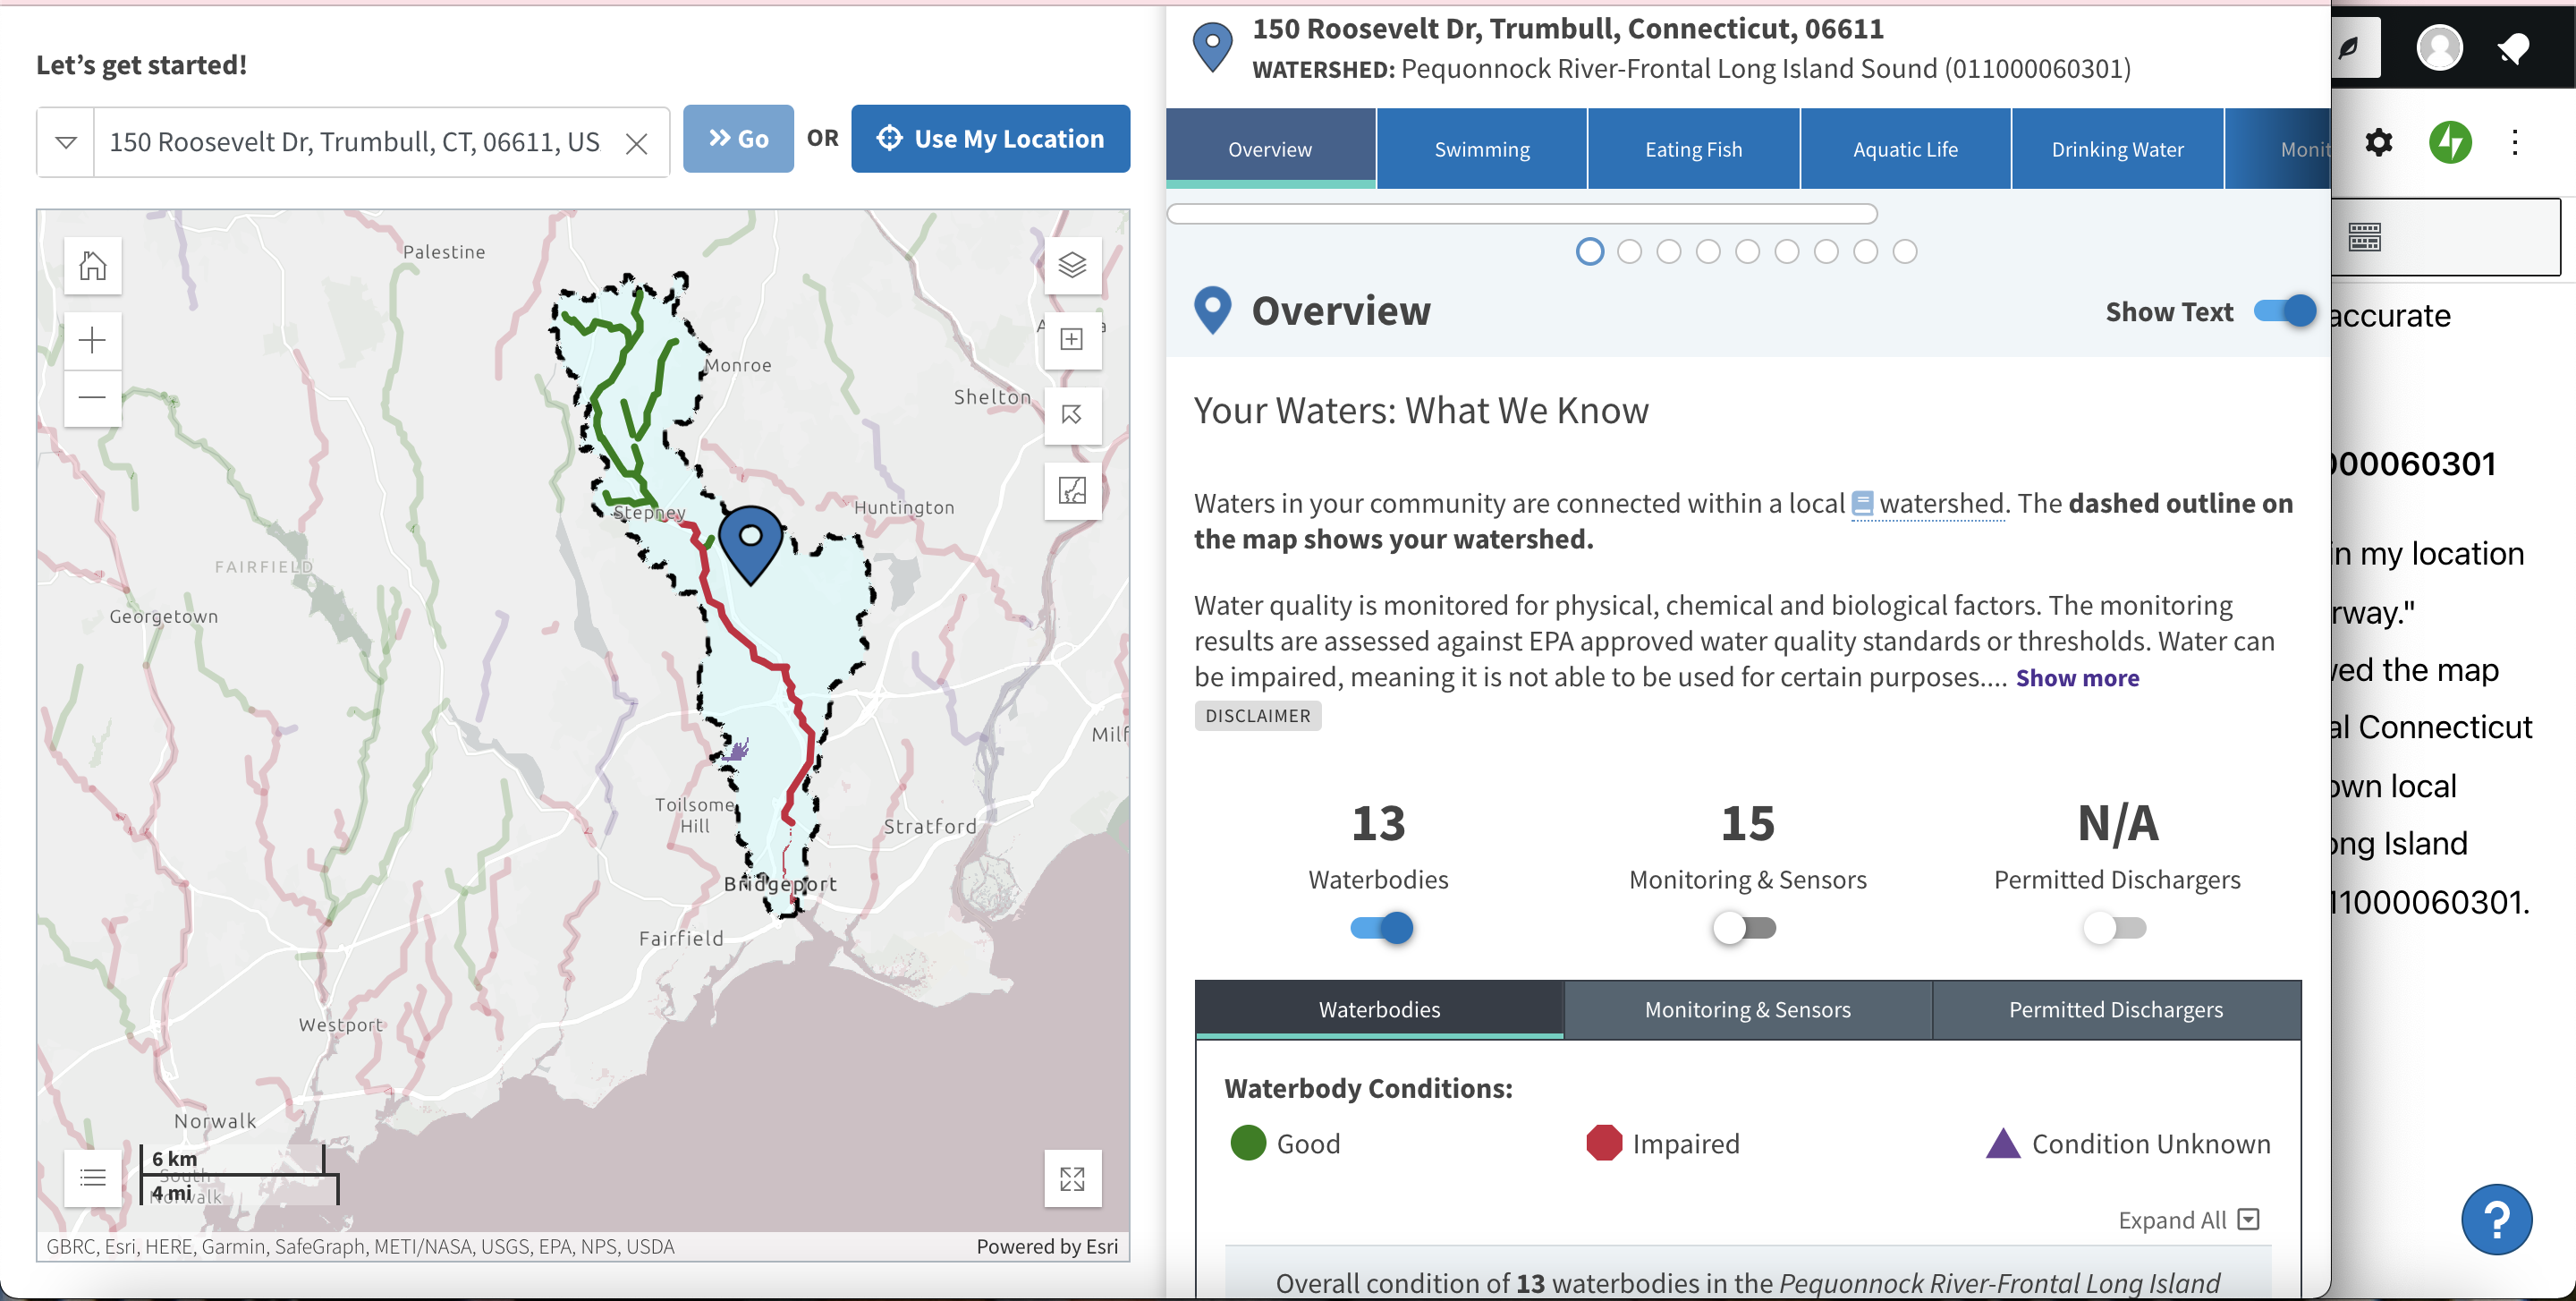
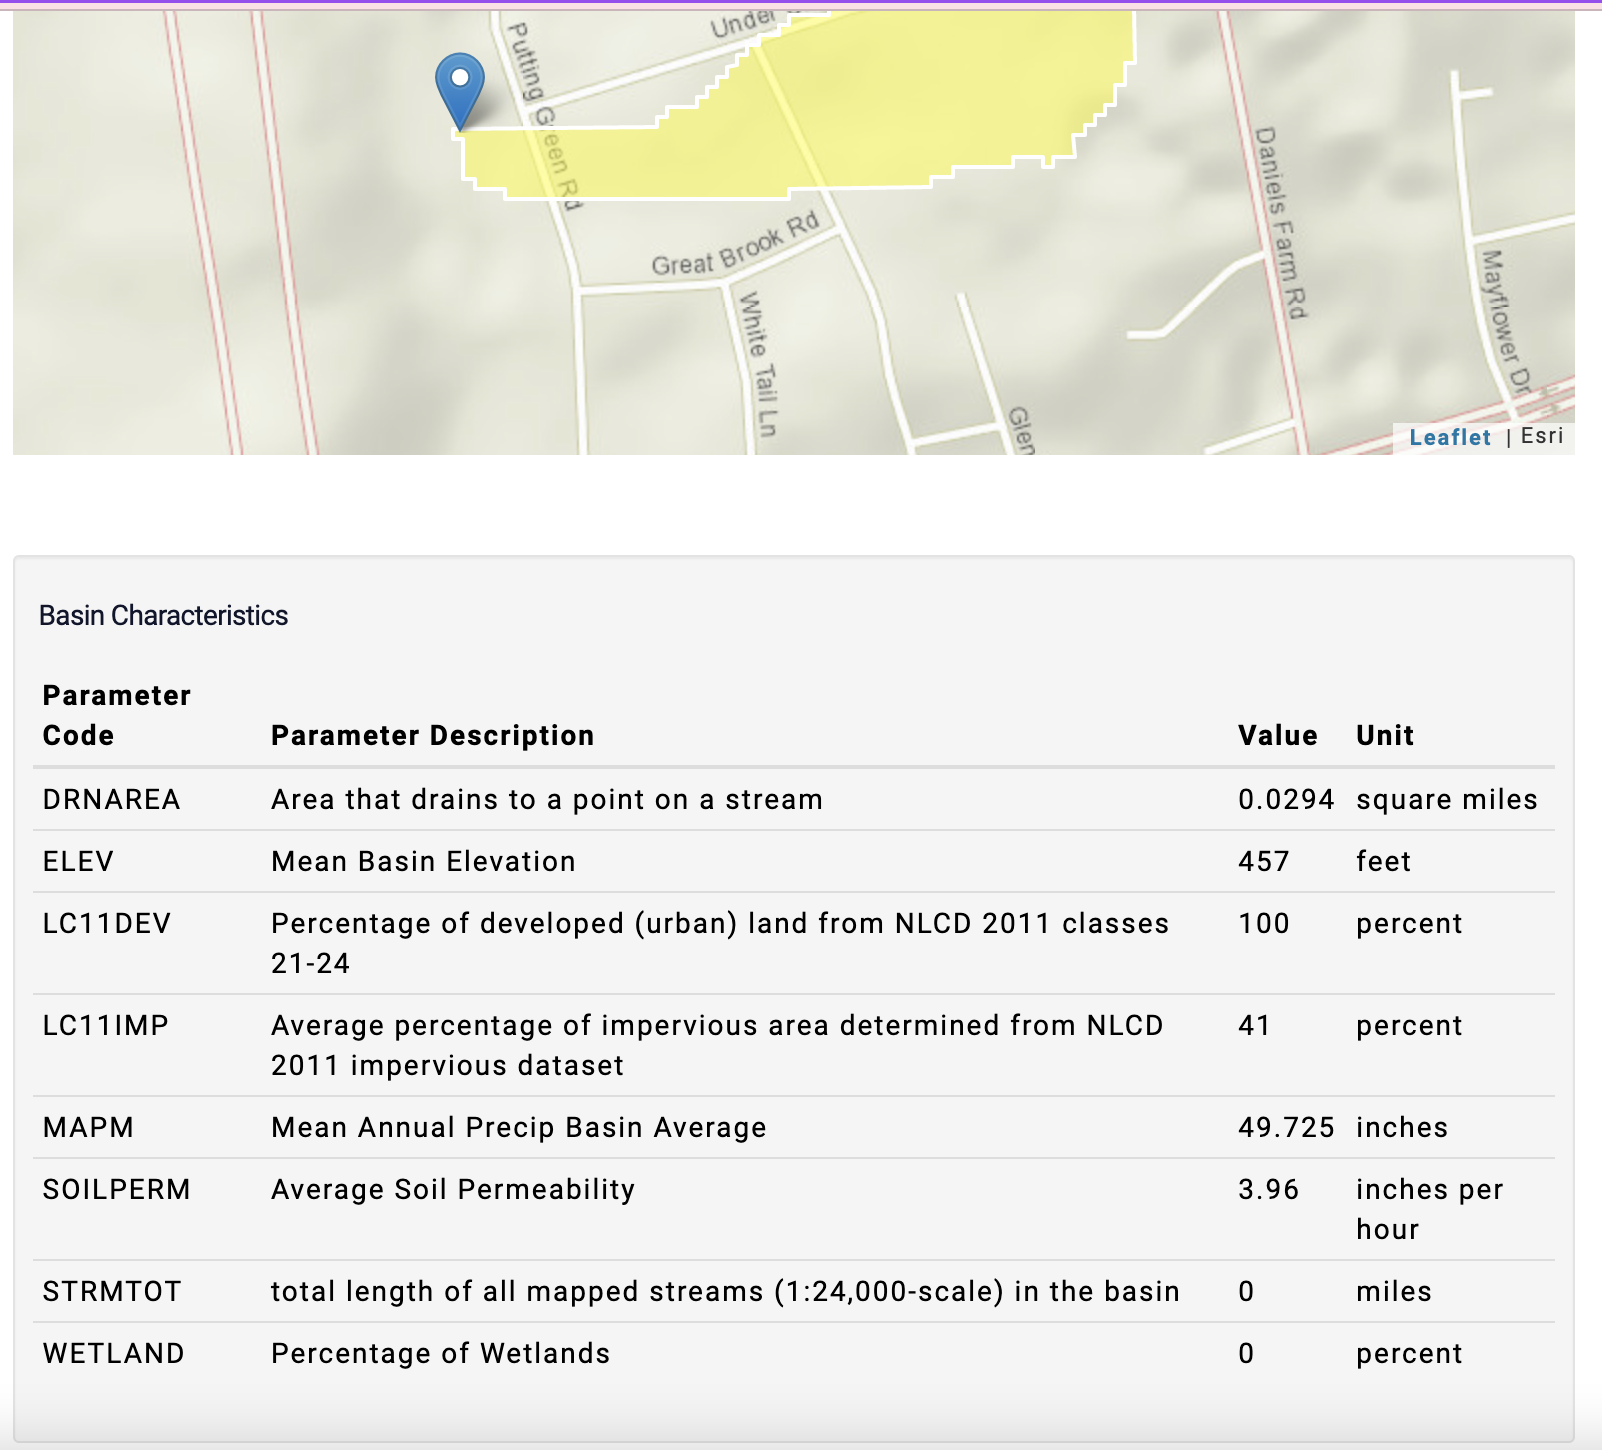
From my previous articles we have learned about my watershed’s characteristics and the inevitable changes it undergoes. In this article I will be discussing the practical and effective tools applied to restore or protect watersheds known as best management practices (BMP). From Watershed Academy Web we know there are 8 tools of watershed protection in developing areas to provide comprehensive watershed protection. My watershed is located along the perimeter of ECSU, a campus that is continuously evolving. By using the resource “StreamStats”  was able to learn about the characteristics of my watershed. The percentage of developed land is 100% due to being surrounded by a college campus and close-knit neighborhoods consisting of families and college students. Furthermore, the percentage of impervious area is 53.6% which is for the same reason. The area that drains to a point on a stream is 2.98 square miles. The mean annual precipitation basin average is 49.797 inches and the average soil permeability is 5.11 inches per hour. The mean basin elevation of my watershed is 367 feet (USGS, 2016). In this article I will be focusing on the BMP my watershed undergoes which consists of aquatic buffers, non-stormwater discharges, and better site design.

Aquatic Buffers

An obvious BMP my watershed practices is aquatic buffers which is simply land adjacent to a wetland edge, a lake or estuarine shoreline, or steam bank where critically important ecological processes and water pollution control functions take place (Kwon and others, 2021). In simpler terms, aquatic areas where land and water meet require special protection which the buffers are in charge of. For my watershed you can clearly see the aquatic buffers in Figure 1 along the stream that is within my watershed that has many uses and benefits. The buffer along a portion of my watershed allows land development to be restricted, and physically separates the stream from future disturbance. This is extremely important for my watershed because it is located i an area that is constantly being renovated and developed, and the buffers prevent the stream from being harmed. As mentioned, my watershed is located along the perimeter of ECSU. Therefore, there is a significant amount of land use close to the stream, especially with a walking trail and Eastern’s Arboretum being alongside of it. Therefore, the buffer protects the water from pollutants and habitat impacts that come along with significant land use.

Furthermore, the buffers are responsible for regulating floods and sustaining the stream’s ecosystems and habitats. Buffers are land conservation areas that are essential to regulate light and temperature conditions, improving the habitat for aquatic plants and animals, effectively removing sediment, nutrients, and bacteria from stormwater and groundwater, and help stabilize and protect the streambanks (Kwon and other, 2021). For the stream within my watershed the buffers come along with streamside zones which is landscape the regulates the movements of sediment, nutrients, and other chemicals from upland forest and agricultural management into streams (USDA, 2022). In my case, my streamside zone is a mature forest with strict limitation on other uses because it is owned and maintained by the university. The university uses this area for science labs and to feature student artwork. As you can see, buffers are essential for protecting watersheds and their quality of water by separating the exposed stream.

1

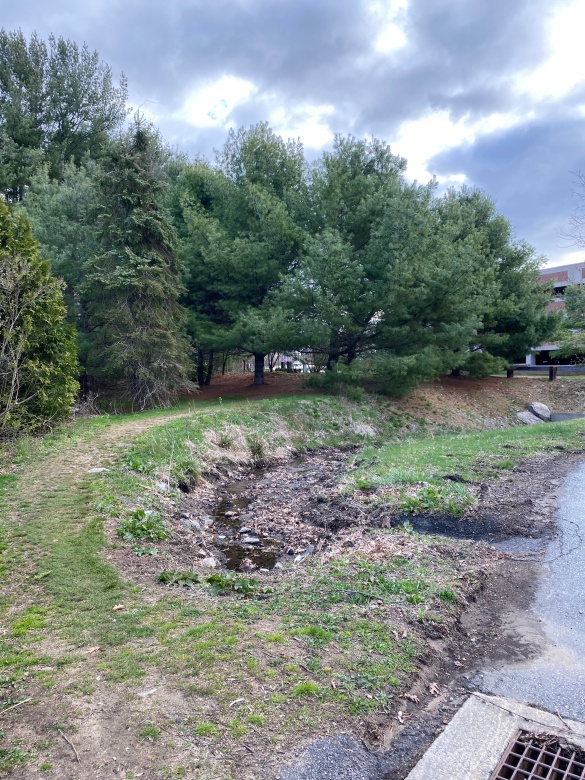
Figure 1: Aquatic Buffers

Better Site Design

The next BMP my watershed practices is better site design. With my watershed being along the perimeter of a university and neighborhood there are significant amounts impervious areas. The stream of my watershed is located within a large cul de sac and surrounded by streets, driveways, and sidewalks within the university and neighborhoods that have consumed natural areas, as you can see in Figure 2. Before COVID I was living on campus in Burnap Hall. My mom attended ECSU in the 1980s and had told me Occum, Burnap, and Crandall halls had little to no updates since. While living in Burnap there were rumors that the university was going to connect Crandall and Burnap with a hallway since the dorms are exactly the same layout to become one hall. The good news is that the university would only be updating already impervious and developed land, and not extending to new grounds which allows the conservation of natural areas. The goal is to protect all bodies of water and existing vegetation by minimizing clearing (Kwon and others, 2021). Furthermore, another wat Eastern practices better site design is by having parking garages because this limits the impervious coverage in the form of parking lots, roads, and driveways for cars specifically. This is an example of innovative site techniques because with a parking garage less natural areas are used with more parking by building up instead of wider. In conclusion, the better site design tool is used to reduce the impacts of land development by utilizing innovative site planning techniques. Unfortunately, even with the proper planning significant development can still degrade water resources, but with the correct plan the harmful affects can be significantly reduced by maintaining undeveloped land.

3

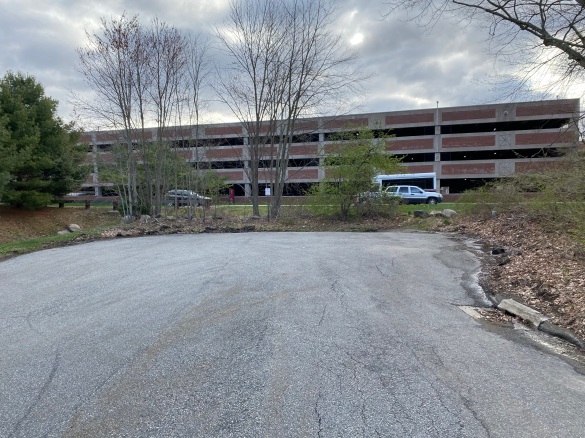
Figure 2: Better Site Design

Non-Stormwater Discharges

The last tool that is utilized for my watershed’s BMP is non-stormwater discharges that dispose wastewater and non-stormwater that flows in a watershed. Non-stormwater flows include runoff from sources other than rainwater which is mostly due to human activities such as car washing (Kwon and others, 2021). The three basic methods of discharging non-stormwater is with septic systems, sanitary sewers and other miscellaneous non-stormwater discharges. For my watershed the septic systems are crucial for disposing wastewater. Septic systems are located all around my watershed around the neighborhoods and the university’s campus. The septic systems are used to discharge wastewater from toilets, wash basins, bathtubs, washing machines, etc. that cause many gallons of highly polluted waters. ECSU includes 8 halls for student living which include washing machine rooms, showers, toilets, and at least 2 sinks for each dorm room along with the several education and resource buildings on campus that have public restrooms. Therefore, imagine the trillion gallons of wastewater each year Eastern alone produces. Due to the widespread use of on-site sewage disposal and the high volume of discharges, septic systems have the potential to pollute groundwater, lakes, and streams if the septic systems fail or are improperly located (Kwon and others, 2021). There is an estimate of 20-25% of septic systems nationwide are not operating correctly, but even properly functioning septic systems can be a source of substantial nutrient loads. Therefore, for my watershed especially, non-stormwater discharges with the use of septic systems is crucial due to the substantial amount of wastewater and non-stormwater a college campus produces around my watershed.

2

Figure 3: Septic Systems

Conclusion

In this article I discussed what BMP my watershed participates in and why those BMP is essential to protect the quality of the watershed located in developing areas. The aquatic buffers are crucial for protection, the better site design tools are important for maintaining undeveloped land, and non-stormwater discharges are in charge of disposing the wastewater and non-stormwater that pollutes our watersheds. In conclusion, each BMP tool requires strategic planning in order to protect and maintain our watersheds, but is beyond crucial so land development does not overwhelm and compromise our watersheds.

References

8 Tools of Watershed Protection in Developing Areas. (n.d.). Retrieved April 20, 2022, from https://cfpub.epa.gov/watertrain/moduleFrame.cfm?parent_object_id=1346

Streamside management zones: Rocky Mountain Research Station. (n.d.). Retrieved April 20, 2022, from https://www.fs.usda.gov/rmrs/streamside-management-zones#:~:text=Streamside%20management%20zones%20(SMZs)%20are,agricultural%20management%20areas%20into%20streams.

Lets Investigate Change in My Watershed

Introduction

Change is inevitable in this world, and that includes for all of our own personal watersheds which can either be natural or anthropogenic. No matter what the cause of change is, the consequences of that are unavoidable. Natural changes can be due to an abundance of factors such as change in the season, floods or droughts, the development of land, population increase, etc. that bring both positive and negative consequences. This article goes into depth about the inevitable changes and consequences my watershed is undergoing with pictures and descriptions.

Personal Information About my Watershed

I was able to locate and find information about my watershed by using “StreamStats”. The outlet of my watershed is located in Willimantic, CT along the perimeter of ECSU and Windham Technical High School which is only a block away from my house. Therefore, the percentage of developed land is 100% due to the watershed being located on school campuses and being surrounded by neighborhoods consisting of families and college students. Furthermore, it is predictable to find that 53.6% of the area is impervious. Impervious areas include land covers such as asphalt, grass, or trees that contribute to a significant amount of stormflow during storms. Both school campuses consist of impervious areas. The area that drains to a point on a stream is 2.98 square miles. The mean annual precipitation basin average is 49.797 inches and the average soil permeability is 5.11 inches per hour. The mean basin elevation of my watershed is 367 feet (USGS 2016). I will now continue to discuss physical changes to my watershed I have realized over the course of a few weeks.

Chemical Consequences

I visited my watershed periodically over the past few weeks and noticed a few changes some anthropogenic and natural. The first to discuss is the abundance of litter that has built up in only the past few weeks! There were several red solo cups and drink cans, but the one that caught my attention was the laundry detergent. The laundry detergent is not only non-biodegradable plastic, but it may also contain left over detergent full of chemicals leaking into the watershed. The chemicals in detergent polluting the water can only be blamed on human action of not properly disposing of it. Garbage in watersheds from land-based activities are carried into storm drains, streams, canals, and rivers by wind. The chemicals can cause eutrophication which means the chemicals cause excessive richness of nutrients that have been absorbed in the watershed that result in dense growth of plant life (Turner, 1970) which we can see in Figure 1 slightly and Figure 2. Notice in Figure 1, the outer area of the watershed is shrinking due to the plant life overwhelming the area that is now decaying. You can tell there used to be water there due to the moistness of the soil along the grasses edge. Therefore, the detergent can have partial responsibility for the watershed being choked with algae and other aquatic plant’s decay. Algae grows because of the lack of oxygen that polluted water suffers from. Water rich in nutrients causes the growth of plant life which leads to the decrease of oxygen in the water which is harmful to aquatic life habitats and results in death and decay(Munn and Hamilton, 2003). One indicator of water quality are bioindicators which are organisms that monitor the health of an ecosystem. Therefore, the chemicals that have caused the water to be polluted can result in the death of these crucial organisms. The service these organisms provide is valuable for water quality assessment (Sinay, 2021). Furthermore, chemicals in a watershed can cause the water to become murky which blocks out sunlight. Chemically polluted water can be toxic to humans and animals who drink from the watershed. Unfortunately, it may not only be one watershed impacted by the nutrient enrichment along with the other problems the chemicals may have caused. All of the issues in one contaminated watershed can be brought to downstream watersheds. 

Figure 1

Excessive Plant Growth

As touched upon previously excessive growth of plant life can be detrimental to a watershed. As you can see, in Figure 2, the water is extremely shallow which has allowed the plants to overgrow with the possible eutrophication. In the top right corner of Figure 2 there is a pipe that is clogged by the abundance of plant growth and plant decay. When plants that are overgrown start to decay like in Figure 2, it causes the water to have a foul odor and taste. Excessive plant life causes the dissolved oxygen in water to decrease which impacts the habitat of the aquatic life causing them to die and decay in our watersheds (Munn and Hamilton, 2003). As vegetation and decay products accumulate it causes the watershed to become a bog and eventually dry land from the displacement of water (Turner, 1970). The excessive amount of plant nutrients controls the rate of algal growth which directly impacts the rate of eutrophication. Algal blooms lower dissolved oxygen concentrations, alter aquatic food webs, effect appearance, alters taste and odor of the water that causes drinking water and fish flesh to taste bad, and produces toxins that are so potent they poison organisms in the water and on land (Munn and Hamilton, 2003). Conclusively, the overgrowth of vegetation life in aquatic environments has adverse consequences for both aquatic and human life.

Figure 2

Seasonal Change

As we are transitioning from Winter to Spring the watershed is being impacted by the seasonal change. In Figure 2 you can see from the previous colder months there is an excessive amount of decaying plants within the watershed. As air temperature increases, the water temperature increases. As the weather becomes warm the growth of algae is promoted. As the water temperature increases the dissolved oxygen levels decrease. The warm water temperature causes an increase of pathogens, nutrients, and invasive species. In addition, the hot sun increases the rates of evapotranspiration resulting in shrinking of some waterbodies. As the hot season continues an increase of impaired waters will occur which causes difficulty in meeting water quality and drinking water standards. Therefore, the availability and quality of drinking water supplies will reduce (Watershed Academy Web). Water temperature is a key indicator of water quality. The aquatic organisms depend on specific water temperatures and conditions to survive. The aquatic organisms are important because they provide a service that maintains the quality of the watershed (Sinay, 2021). In addition, organisms that decay in the watershed are harmful as discussed previously. Although these are natural consequences, as the weather gets warm we can expect anthropogenic impacts as well. As it gets warmer more families and college students are walking outside especially with their pets. As I was inspecting my watershed for this project I noticed several people and their animals walking on the path alongside the watershed shown in Figure 3. Pathogens and high concentration of nitrogen from animal feces can enter the watershed by direct disposition or a result from overland runoff containing fecal matter. As discussed before, excessive plant growth in watersheds is harmful for a variety of reasons. The release of nutrients from decay of pet waste promotes weed and algae growth (Whitlock 2002). Fecal pollution is contaminating the water with disease-causing organisms called pathogens that can inhabit the gastrointestinal tract of mammals. Ingestion of this contaminated water is responsible for several humans diseases known as fecal-oral route (Santo-Domingo and others, 2008). Therefore, change in temperature results in natural and anthropogenic consequences.

Figure 3

Ecosystem Services

Healthy watersheds provide ecosystem services such as nutrient cycling, carbon storage, erosion/ sedimentation control, increased biodiversity, soil formation, wildlife movement corridors, water storage, water filtration, flood control, food, recreation, reduced vulnerability to invasive specials, and many more that are beneficial (United States Environmental Protection, 2021). When a watershed is polluted all of these services are as well. An inevitable issue every watershed faces is stormwater runoff. My watershed being located on a university and high school campus has many hard surfaces with the university roads and school buildings. All stormwater like rain and melting snow does not soak into the ground, but runs off into storm drains that are directly connected with pipes to the closest waterbody with whatever pollution was picked up on the way (Mississippi Watershed Management Organization). Stormwater runoff is a major source of water pollution for any and every watershed. Globally water has been being treated as infinite and of little value for far too long, and water quality and quantity are severely overlooked. For the quality measurement of water there are six main indicators that range of chemical, physical, and biological properties which are dissolved oxygen levels, turbidity, pH levels, bioindicators, nitrate chemicals, and water temperature (Sinay, 2021). From previous discussion depleting dissolved oxygen levels can be caused by a variety of reasons such as eutrophication from polluting chemicals causing plant life overgrowth, algal blooms, and water temperature rising. Dissolved oxygen is essential for humans, plants, and animals. High levels of oxygen in the water is crucial to sustain life. Dissolved oxygen levels in watersheds is a key indicator of the water’s quality (Sinay, 2021). Turbidity measures how clean and clear the water is which depends on the amount of Total Suspended Solids (TSS) such as gravel, sand, silt, clay, and algae. As previously discussed algae grows when there is lack of oxygen in polluted waters, when water temperature increases seasonally, and from decay products. When animals, plants, and algae decay they become suspended solids (Sinay, 2021). While discussing the impact of chemical pollution we touched upon bioindicators and their importance for an ecosystem such as a watershed. Chemically polluted waters can lead to disease or death of organisms including these beneficial bioindicators that provide service by maintaining their environment in the watershed. While discussing how animal waste enters the watershed and the consequences that follow along high concentration of nitrogen was mentioned. High concentration of nitrogen in a watershed is due to the flow of humans and animal waste. The consequences of a watershed having a high concentration of nitrogen include algae growth which we discussed can be harmful and reduces the amount of dissolved oxygen in the water which we know kills aquatic life such as bioindicators (Sinay, 2021). Another key indicator of water quality is the pH level which determines if the water is basic or acidic. The fluctuation of pH levels can be due to acid rain, automobile pollution, agricultural runoff, spills from accidents, overflows from sewers, and other pollutants that are both natural and anthropogenic. Significant changes of pH can negatively impact the water and aquatic life such as bioindicators (Sinay, 2021). Lastly, as we discussed previously water temperature changes as the seasons do. Water temperatures impact dissolved oxygen and vulnerability of organisms, pollution, and disease as we know from previous discussion is detrimental to the watershed. To conclude, the ecosystem services that occur naturally maintain the quality and quantity of our watersheds. Every aspect of a watershed has importance especially the aquatic plants and organisms maintaining their environment, and in the process maintaining our watersheds. It is our responsibility to avoid polluting watersheds so our aquatic plants and organisms continue their ecosystem services.

Conclusion

The changes I observed in my watershed are too common. Although we can not prevent natural causes we are responsible for putting an end to the anthropogenic ones. Correctly disposing garbage and cleaning up pet’s waste are only two simple ways to maintain our watersheds. As we can see, every change has a consequence some good, but the majority bad that I noticed in my own watershed. Aquatic organisms are constantly maintaining their environment and doing their part to maintain our watersheds, and unfortunately it is mostly due to anthropogenic ignorance that their sustainable environments are compromised along with our watersheds. The worst part is this is a chain reaction to all downstream watersheds. Therefore, it is in all of our hands ton maintain our watersheds.

References

Benefits of Healthy Watersheds. (n.d.). Retrieved March 23, 2022, from https://www.epa.gov/hwp/benefits-healthy-watersheds

Dunn, M., & Hamilton, P. (2003). New Studies Initiated by the U.S. Geological Survey-Effects of Nutrient Enrichment on Stream Ecosystems. Retrieved March 23, 2022, from https://pubs.usgs.gov/fs/fs11803/

The Effect of Climate Change on Water Resources and Programs. (n.d.). Retrieved March 23, 2022, from https://cfpub.epa.gov/watertrain/moduleFrame.cfm?parent_object_id=2456&object_id=2459

M. (2020, April 20). Watershed and stormwater basics. Retrieved March 23, 2022, from https://www.mwmo.org/learn/watershed-and-stormwater-basics/

Sinay. (2021, May 11). What are the main water quality indicators and parameters? Retrieved March 23, 2022, from https://sinay.ai/en/what-are-the-main-indicators-of-water-quality/

Turner, J. (1970, November 01). Laundry detergent: The effect of pollution on lakes and Rivers. Retrieved March 23, 2022, from https://www.motherearthnews.com/sustainable-living/nature-and-environment/effect-of-pollution-zmaz70ndzgoe/

USGS, 2016, StreamStats Report for 41.7203, -72.2177, StreamStats Application version 4.3.0, U.S. Geological Survey, accessed March 23, 2022 at https://streamstats.usgs.gov/ss/.

Their Watershed, My Watershed, Your Watershed… Our Watershed. By: Isabella Osak

Introduction

A watershed is an area of land from which all water drains to the same river, lake, or other body of water. Everyone has their own local watershed no matter where they’re located, and has a responsibility of doing their part to maintain the health of their watershed. The health of an individual’s watershed depends on the health of upstream watersheds, and what happens in their watershed can impact the quality of downstream watersheds. Activities such as car washing, dog walking, using fertilizer, driving/ parking a car, and the use of herbicides and pesticides can harm the downstream watershed ecosystems. Therefore, the individual’s actions not only impact their watershed, but also several others downstream.

My name is Isabella Osak I grew up in Trumbull, CT, and therefore am basing my local watershed on that location. In this article, I have done extensive research on my local watershed using three resources “Science In Your Watershed: Locate Your Watershed”, “How’s My Waterway”, and “Streamstats” to see statistics and aspects of my specific watershed. I then discussed the information in further detail with my knowledge about watersheds in general. These resources were user friendly, available to all, and provided all types of interesting information about my personal watershed.

My Local Watershed: HUC 01100006

By using the resource “Science In Your Watershed: Locate Your Watershed” created by the United States Geological Survey (USGS) I was able to find my 8-digit Hydrologic Unit Code (HUC) that is simply the identification number for watershed locations. My watershed is located in HUC 01100006 which includes The Long Island Sound and several rivers including Mianus River, Rippowan River, Norwalk River, Silvermine River, Saugatuck River, Aspetuck River, Mill River, and Poquonok River. (USGS Science In Your Watershed, 2022). The Poquonok River is very close to home because of the local paved walking trail along side the river for residents and their families to enjoy that I have been going to since I was a child.

water1

(Figure 1) Map of the watershed in the area I live in from the United States Geological Survey’s (USGS) website, “Science In Your Watershed: Locate Your Watershed” which highlights my HUC 01100006 and shows the majors bodies of water included within.

Through the USGS website I discovered another useful resource which is a document from 1970, “Water Resources Inventory of Connecticut Part 4 Southwestern Coastal River Basins.” The beginning of this document discusses the 394 square miles of the southwestern coastal river basins of Connecticut. The area under review in this article includes the drainage basins of all streams that enter the Long Island Sound between the mouth of the Housatonic River and the western border of the State (Ryder and others, 1970). These river basins create about 183 billion gallons or 23.9 inches of runoff during an average year almost entirely acquired from precipitation falling on the basins (Ryder and others, 1970). Eventually these basins are drained by more than 20 streams into the Long Island Sound. The largest drainage basin is located in the Saugatuck River and is 92.1 square miles (Ryder and others, 1970). The document also goes into further detail about Connecticut experiencing a rapid population increase for the past few decades which also brought along industrial expansion changes in agricultural technology and a rising standard of living. Therefore, due to the higher demands naturally there was also a steadily rising demand for water that is only expected to continue. As the demand for water increases, the need for accurate information and attentive planning is as well.

Hydrological Unit: Pequonnock River-Frontal Long Island Sound 011000060301

For further research on my local watershed while getting more specific with my location using the United States Environmental Protection Agency’s (US EPA) resource, “How’s My Waterway.” Furthermore, this website allowed me to input my address which narrowed the map down immensely. In other words, instead of researching about southwestern coastal Connecticut basins I am now discovering information from a much more narrowed down local friendly map. My address is located on the Pequonnock River-Frontal Long Island Sound Watershed which is labeled with the 12-digit Hydrological Unit 011000060301.

Screen Shot 2022-02-01 at 8.49.28 PM

(Figure 2)The map of my watershed located on the Pequonnock River-Frontal Long Island Sound Hydrological Unit 011000060301 from the United States Environmental Protection Agency’s (US EPA) website, “How’s My Waterway.”

Simply, while using this resource and inputting my address as instructed the website automatically compiled extensive information about my local watershed. Therefore, the website revealed that there are 13 waterbodies that make up my local watershed. While most of the waterbodies are in good condition there are several that are impaired meaning they are contaminated (US EPA How’s My Waterway, 2022).  This can be caused by a variety of reasons and means those waterbodies are not safe water resources. Out of the 13 waterbodies that make up this watershed only 4 of them are impaired and only one has an unknown status. The four bodies of water that are compromised are the LIS WB- Bridgeport Harbor (Bridgeport), Pequonnock River (Bridgeport)-01, Pequonnock River (Bridgeport/ Trumbull)-02, and Pequonock River and the body of water that has an unknown status is Forest Lake (Bridgeport) (Trumbull)-03 (US EPA How’s My Waterway, 2022). An interesting observation I made using this resource was that the Pequonnock River I know so well from my childhood makes up 5 out of the 13 bodies of water in my watershed.

Delineating My Local Basin

The last resource I used to do even further research on my watershed was another website of the United States Geological Survey’s (USGS) website, “StreamStats.” This USGS website allowed me to delineate my local basin and revealed the basic characteristics of the basin closest to my home address. Therefore, this resource allowed me to get even closer and more specific information on my closest watershed.

Screen Shot 2022-02-01 at 9.32.31 PM

(Figure 3)Table of characteristics for the basin I live on found using the United States Geological Survey’s website, “StreamStats.”

From the table I discovered several specific characteristics about my basin such as the mean annual precipitation basin average, the area that drains to a point on a stream, mean basin elevation, percentage of developed land, average percentage of impervious area, mean annual precipitation basin average, average soil permeability, total length of all mapped streams, and the percentage of wetlands. The mean annual precipitation basin average for my basin is 49.725 inches. Additionally, the percentage of developed land in my location is 100% while there is 0% of wetlands due to me living in a very urban area where new homes are consistently being built. Since no streams were mapped within my basin there was also 0% lengths of streams. (USGS StreamStats, 2022)

Summary

Overall, doing this research on my local watershed was beneficial because I learned specific aspects about my watershed which only encourages me to do my part in maintaining the health of it. The resources I used in order to do my research were extremely informative, efficient, and useful. I enjoyed learning the name of my watershed, the health and names of waterbodies incorporated within my watershed, and the particular characteristics about the basin I live on. I highly recommend using these resources to discover information about your own watershed to become involved!

Works Cited

“How’s My Waterway?” EPA, Environmental Protection Agency, https://mywaterway.epa.gov/community/150%20Roosevelt%20Dr,%20Trumbull,%20CT,%2006611,%20USA/overview.

Ierardi, Michael C. “Science in Your Watershed.” Science in Your Watershed – HUC 01100006, https://water.usgs.gov/wsc/cat/01100006.html#.html.

Robert B. Ryder, Michael A. Cervione Jr., Chester E. Thomas Jr., and Mendall P. Thomas, 1970, Water resources inventory of Connecticut Part 4: Southwestern Coastal River Basins. Connecticut Water Resources Commission

StreamStats, https://streamstats.usgs.gov/ss/.

Ucar/comet. “Teaching and Training Resources for the Geoscience Community.” MetEd, https://www.meted.ucar.edu/index.php.